AI research could use more toys
circa Dec. 2022
[This started out as a quick pointer to Diffusion Grid, but ended up as some musing about visualization in research.]
Moving pictures
Something that stuck with me after reading James Gleick's Chaos ages ago—back when "chaos theory" was prominent in pop culture, and especially in pop science, slightly akin to how AI is treated today—was how important visualization and intuition felt to people working in that area:
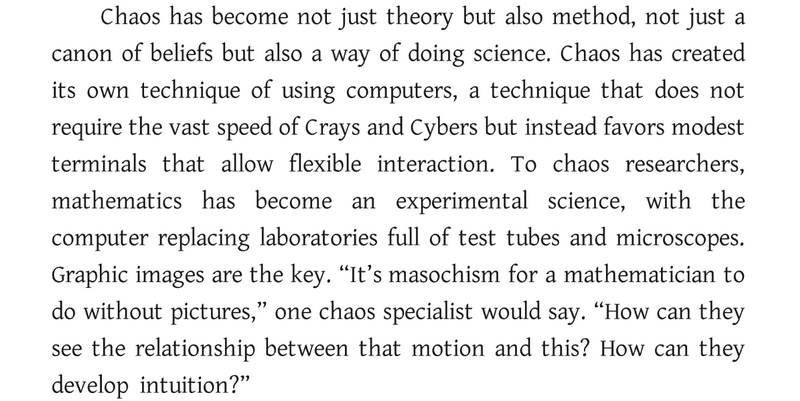
Sounds kind of overblown from 30 years' distance, although maybe that's just "'Seinfeld' Is Unfunny" for science?
I have no idea whether Gleick accurately characterizes the research culture in chaos / nonlinear dynamics, then or now. I raise this example only because I think there's a rough connection to AI, and that these anonymous "chaos specialists" aren't wrong. Maybe we'd all benefit from a little more of their attitude?
Here's the thought process:
- Modern AI research has a significant empirical component[1].
- As a result, progress is made at least partly by guess-and-check, where the "guess" step is performed by the researcher / by Graduate Student Descent.
- Guessing involves intuition.
- Researcher intuition is therefore a relevant input to research progress.
- We might benefit from ways of improving that intuition.
Visualizations are ubiquitous today. Computers are good at producing them, and we do. What I think we could use more of are visualization toys.
Toys not tools
Tools have specific practical purpose. Toys do not.
Here's a typical visualization:
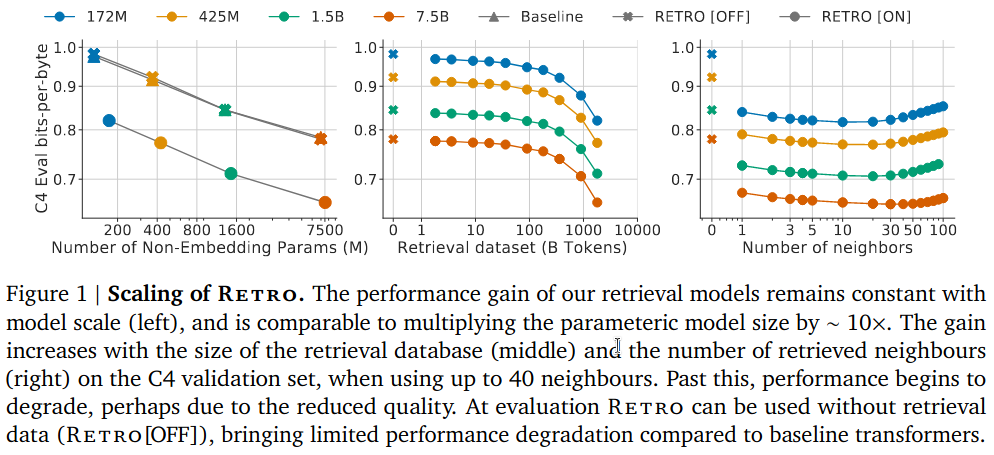
This visualization is a tool. It was designed and published to reinforce the points provided in the caption[2].
Here's another one:
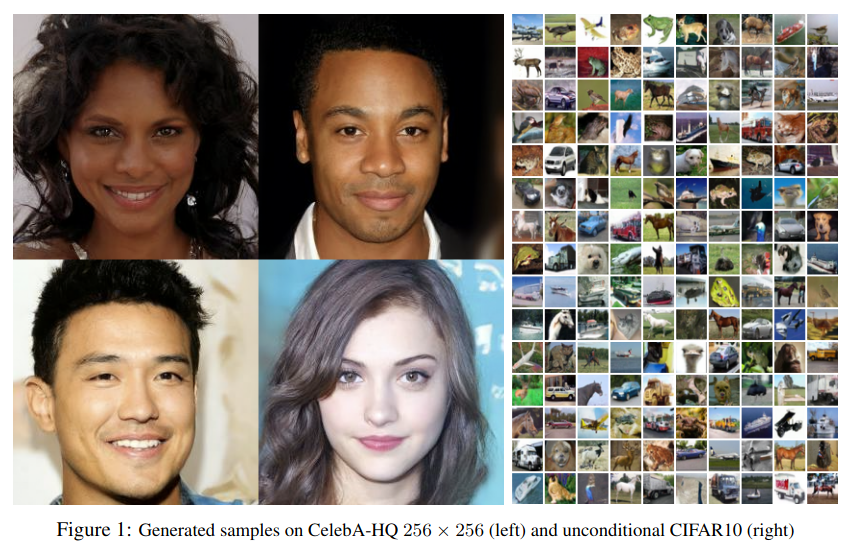
This visualization is less focused. It's a tool, intended to convey good sample quality, but it's more toy-like: the reader feels encouraged to look at the samples provided and follow their own train of thought. That's a limited flavor of freedom, though. To the extent that this example is a toy, it's not a very fun one.
Here is an off-the-cuff theory of research toys:
- They have minimal starting friction. (You can play with them immediately.)
- They are probably visual. (Their output can be consumed and interpreted directly.)
- They admit exploratory freedom. (They probably feature some interactivity.)
- They are at least moderately fun. (They provide some kind of engaging UX.)
Visualization itself might be a toy. I love me some ggplot(). No one outside a project's core research team gets to play with this toy, however, at least not easily. And any particular visualization artifact is more like a screenshot from Minecraft: it may contain interesting information, but someone else was actually playing the game.
Toy for trajectories
When I sat down to write this blog post I really just wanted to point out Diffusion Grid, a thing I made. Consider everything above to be an elaborate justification for spending the time to build it.
It's a simple visualization toy for diffusion model trajectories. It visualizes "paths not taken" during the denoising process.
I realized that I didn't have any idea how image structure emerged within the reverse trajectory. What kind of "choices" are made earlier? Later?
I'm not trying to do research, I just wanted the process to feel more intuitive. So I built a toy.
Specifically, it shows images produced by several trajectories branching from each of several different timesteps:
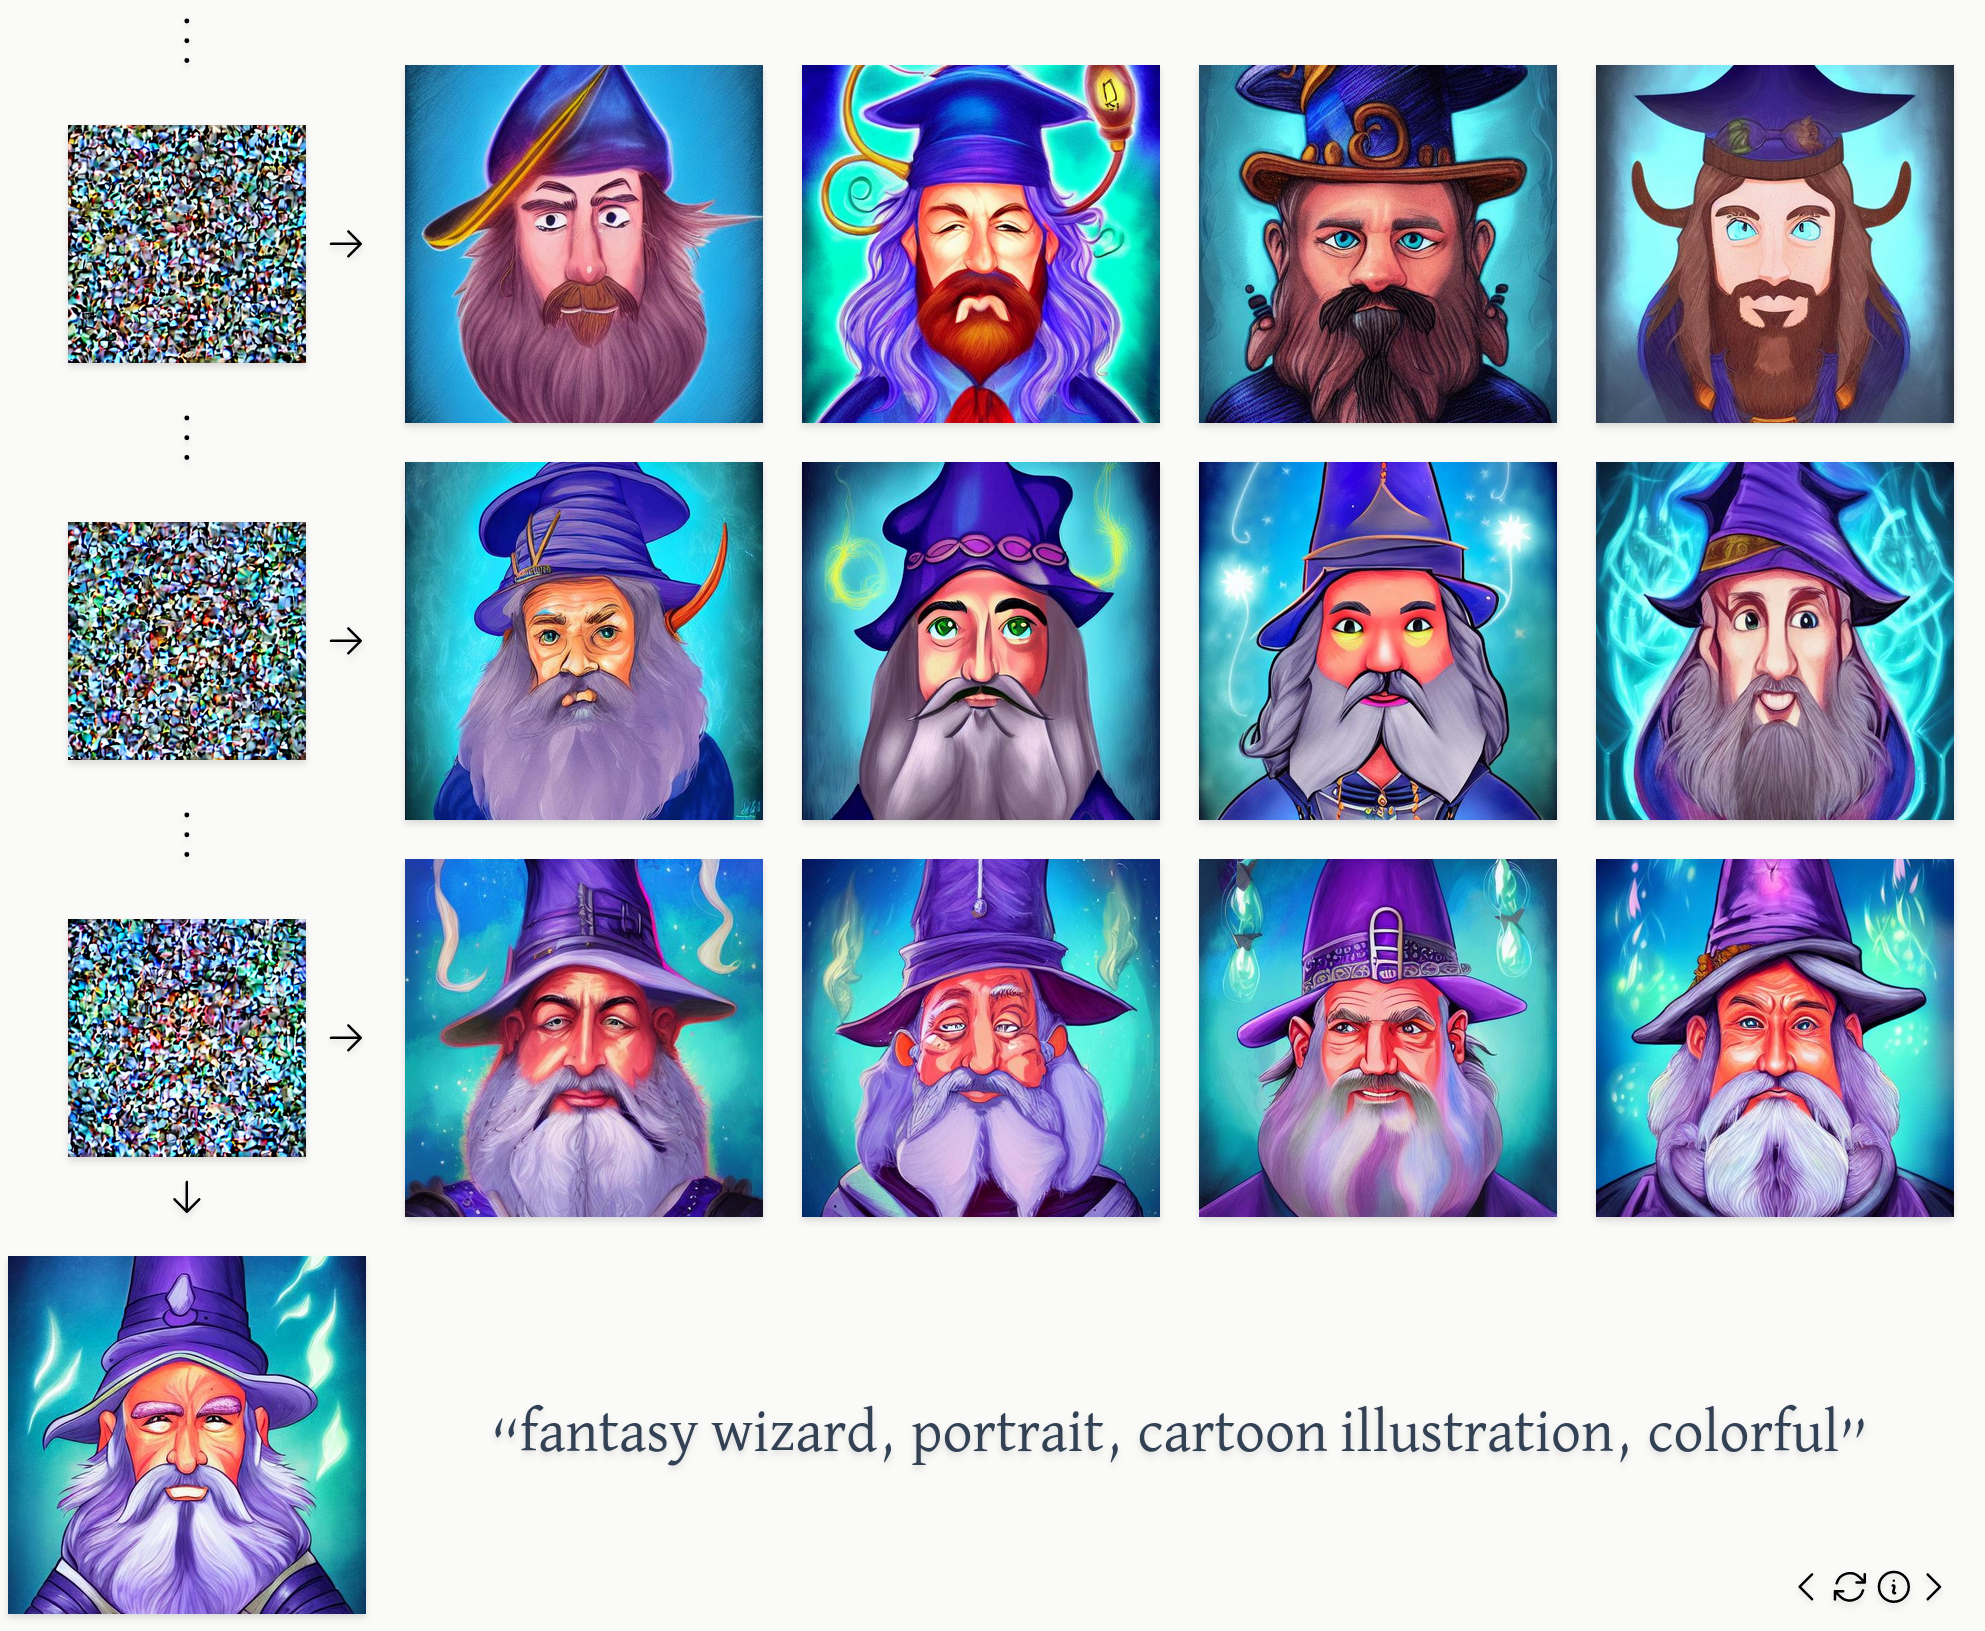
We can imagine different trajectories, producing different images, all starting from the same random initial position. If we focus on one of these trajectories, we can also imagine different possible trajectories branching from each point on that trunk, i.e., sets of trajectories that are all identical up to a given timestep. Trajectories branching from later timesteps will be more similar than trajectories branching from earlier timesteps.
This process turns out to be visually interesting and kind of fun to play around with. I can't measure "intuition", but I feel more comfortable with my understanding after playing with it. That has to count for something.
Are notebooks toys?
What other toys are out there? I haven't gone hunting, but I think there's one popular example.
There are lots of reasons to be careful with Jupyter-style notebooks, and especially with distributing notebooks as research artifacts. But! One reason to like them may be that they're kind of toy-like.
Specifically, they hit all my "theory of toys" points to some degree: they can offer minimal starting friction (but this is probably their weakest area), they are typically quite visual, they admit a ton of user freedom, and they're often fun to explore—if they offer quick feedback loops.
Maybe that's one reason notebooks are popular, especially for mass experimentation. How much of the broader Stable Diffusion community was built through passing around Colab links? How many of those users played around with the widgets, not the code?
(Gradio might make for even better toys.)
Fin
That's it. Toys are good. Have fun!
❧